Performance explorer
The performance explorer is a dynamic report giving you a precise view of your media mix and letting you compare the performance of your traffic sources at a glance.
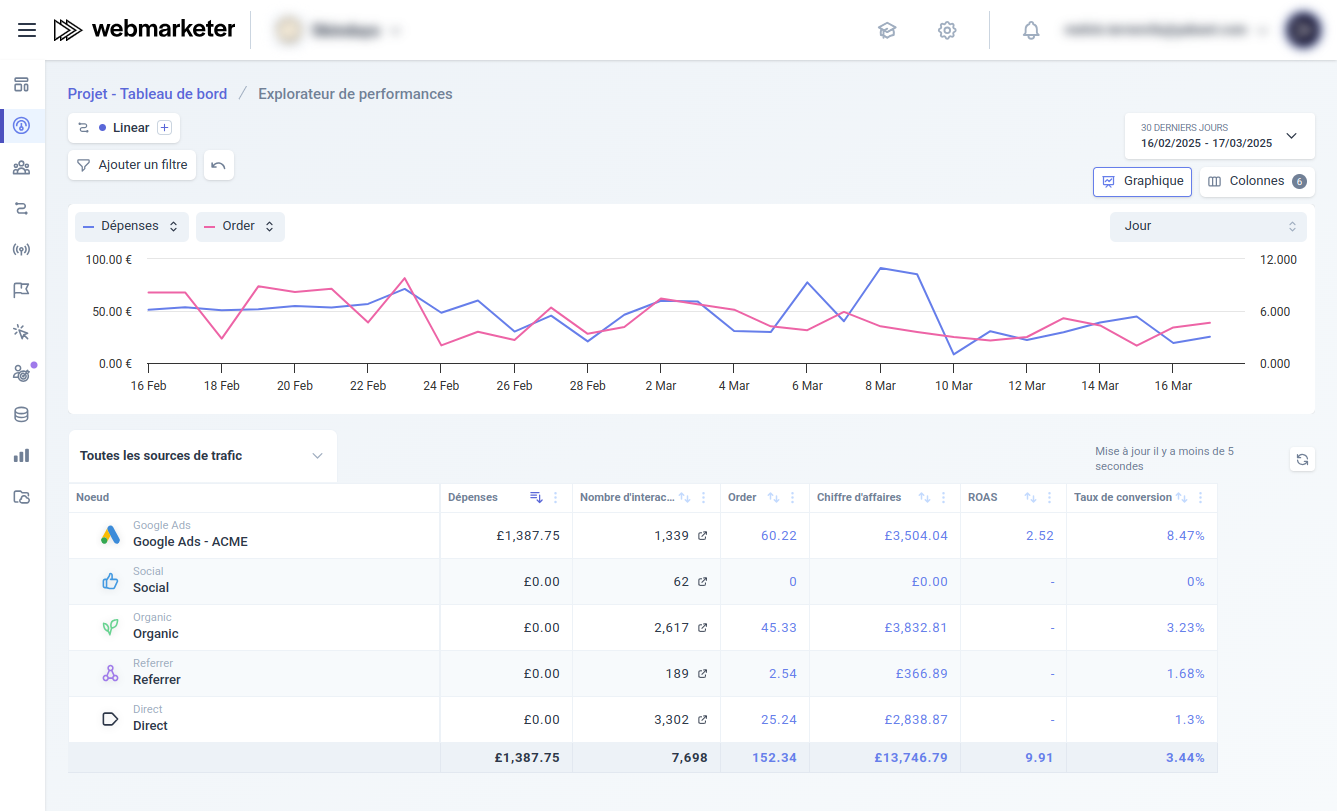
It lets you:
- analyze (without sampling) every metric of your project:
- session duration
- number of pages per session
- number of events (overall or for a specific type)
- ad spend
- conversion rate
- cost per lead
- revenue
- ROAS
- number of meetings booked
- or any other metric you configured in your project
- compare the performance of your various traffic sources impartially
- compare your different attribution models
- narrow down the results using a wide range of filters
Choosing the attribution model(s)
In the performance explorer, the collected data being displayed is attributed data. That data therefore depends on the attribution model that attributed it.
- By default, the performance explorer uses your primary attribution model
- You can pick another model to display among the ones you configured
- You can also select several models to see their respective attributions and compare them
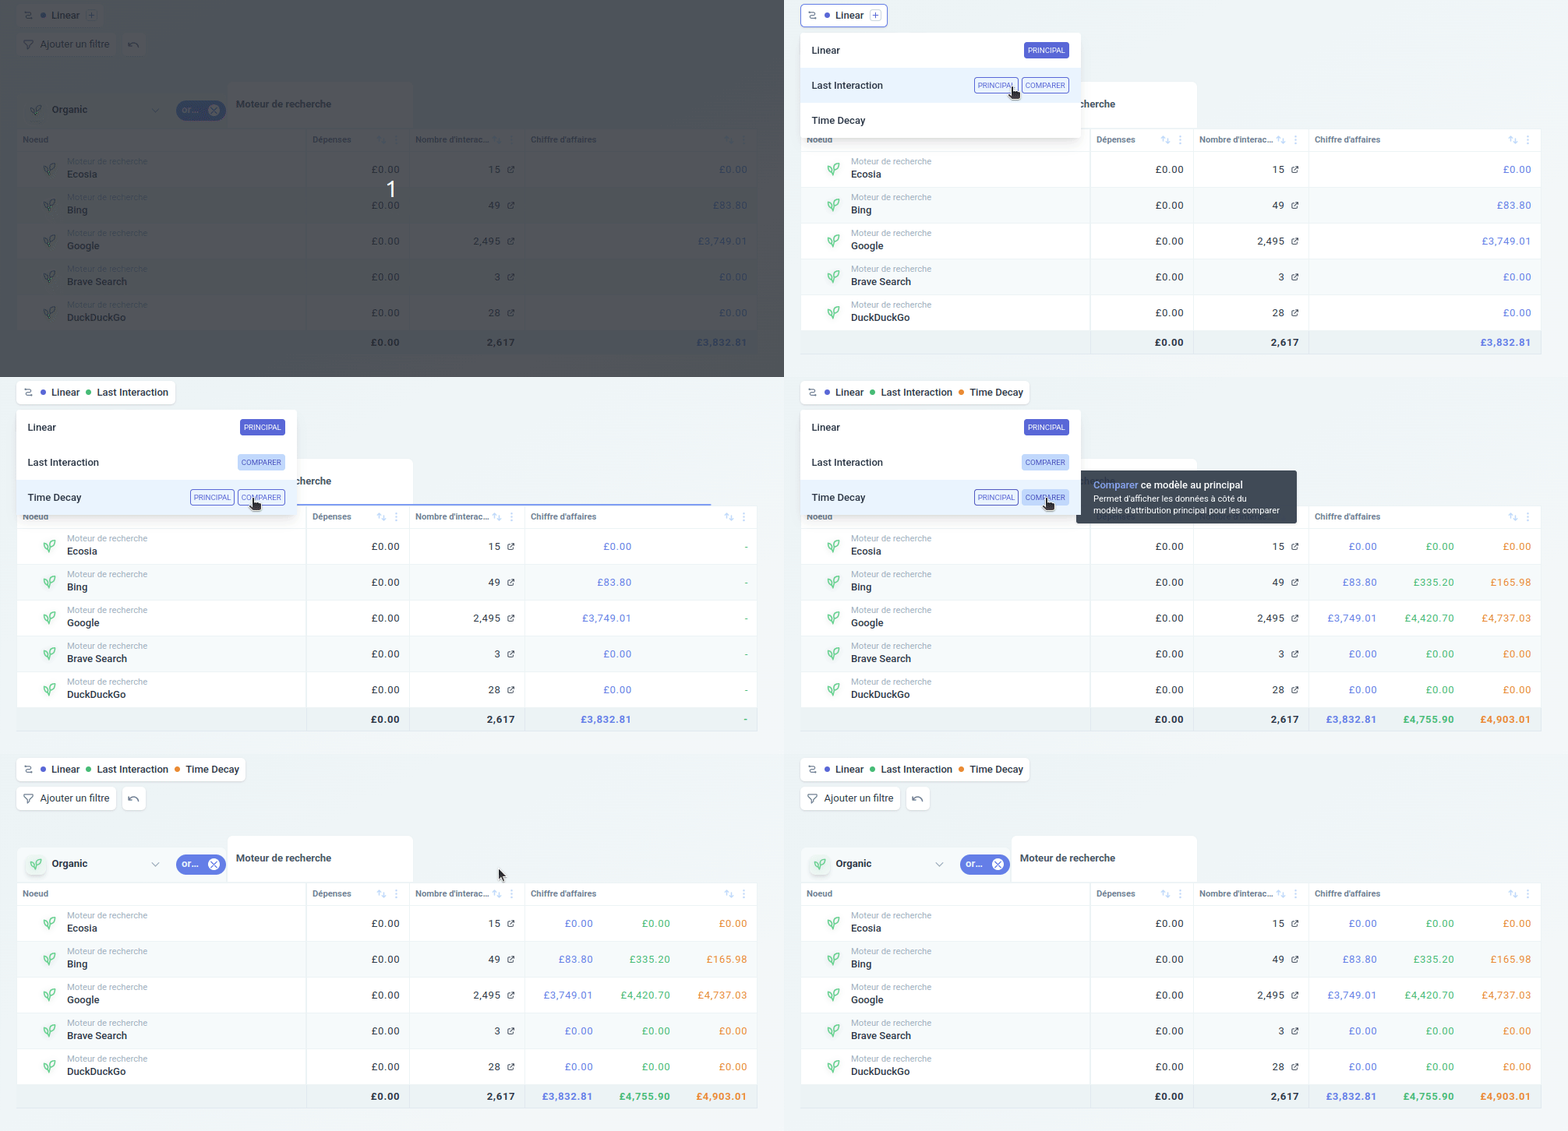
How many models can be configured at once in your project may depend on the plan your workspace is subscribed to.
Filtering
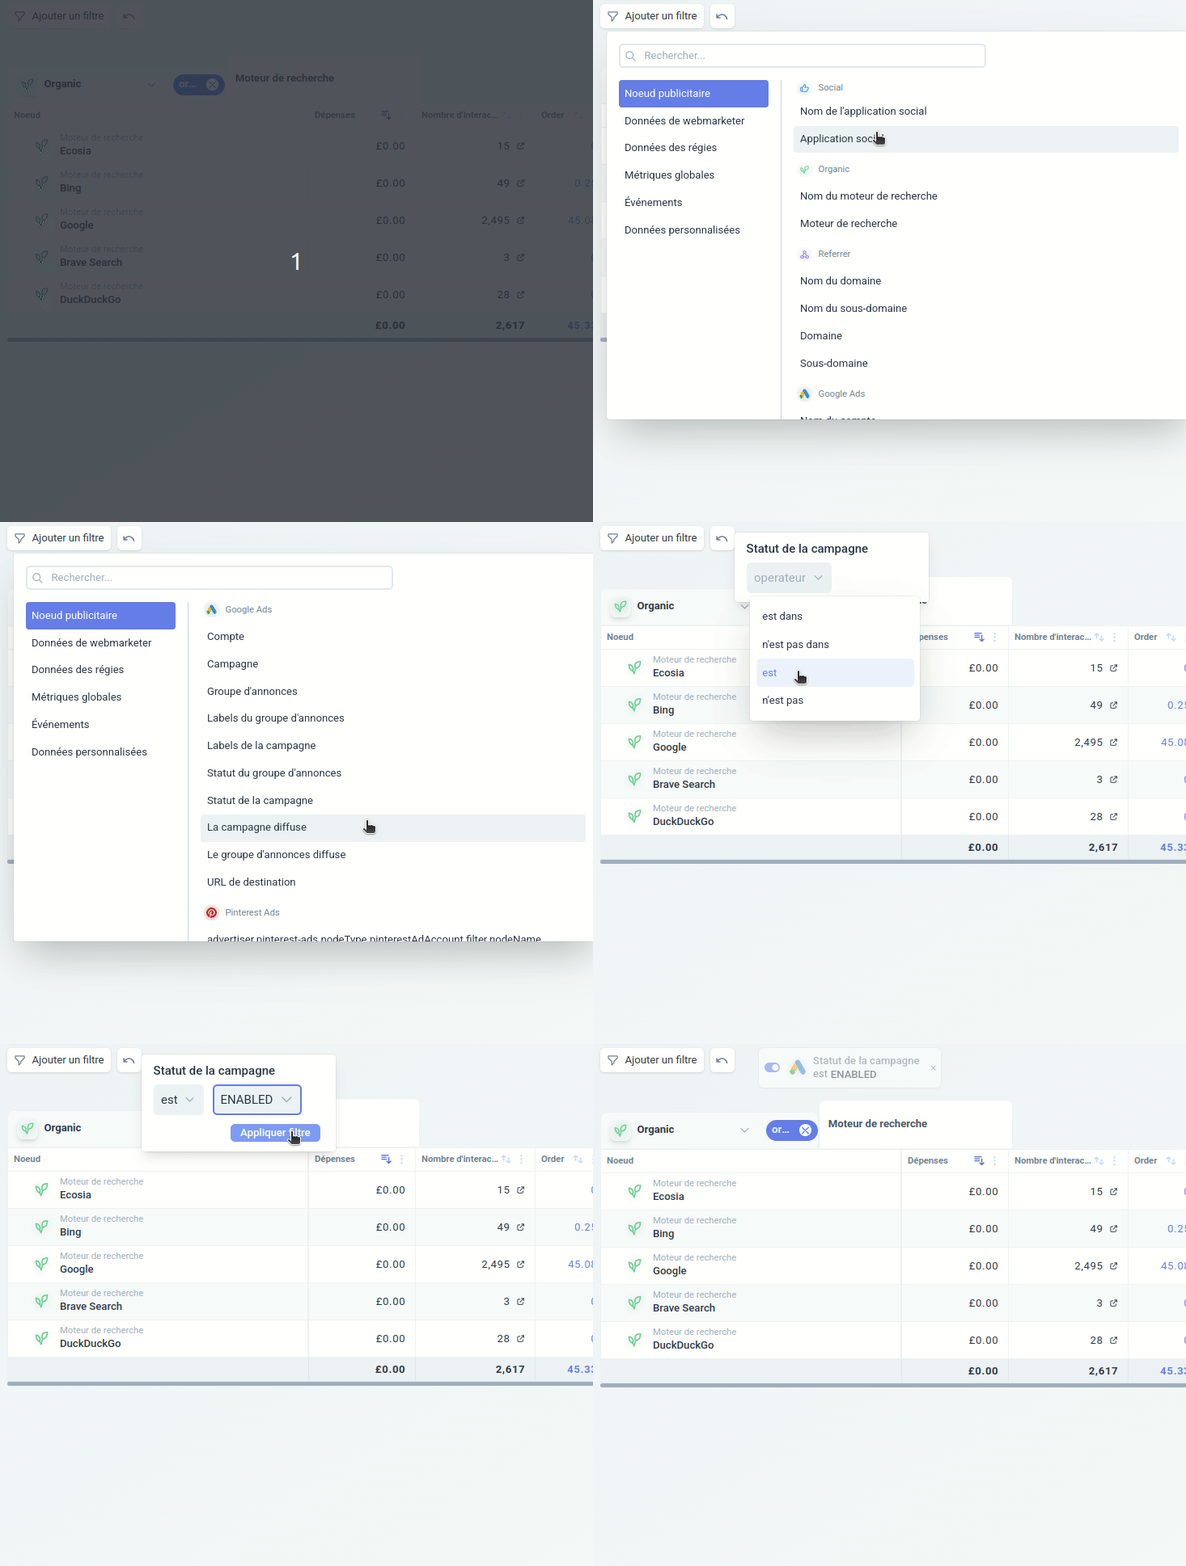
You can filter the columns and the traffic sources displayed by the performance explorer through the filter system. That way, you only display the information you care about.
Date range
The performance explorer displays the data collected by Webmarketer over a given date range. That range can be customized with the date picker.
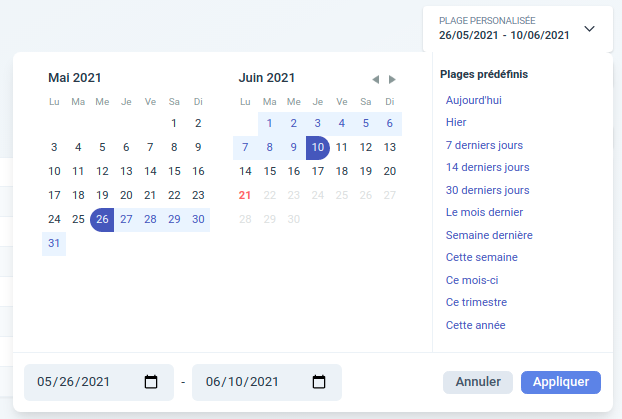 Date range filter
The earliest date selectable in that picker depends on the retention period your plan allows for your data.
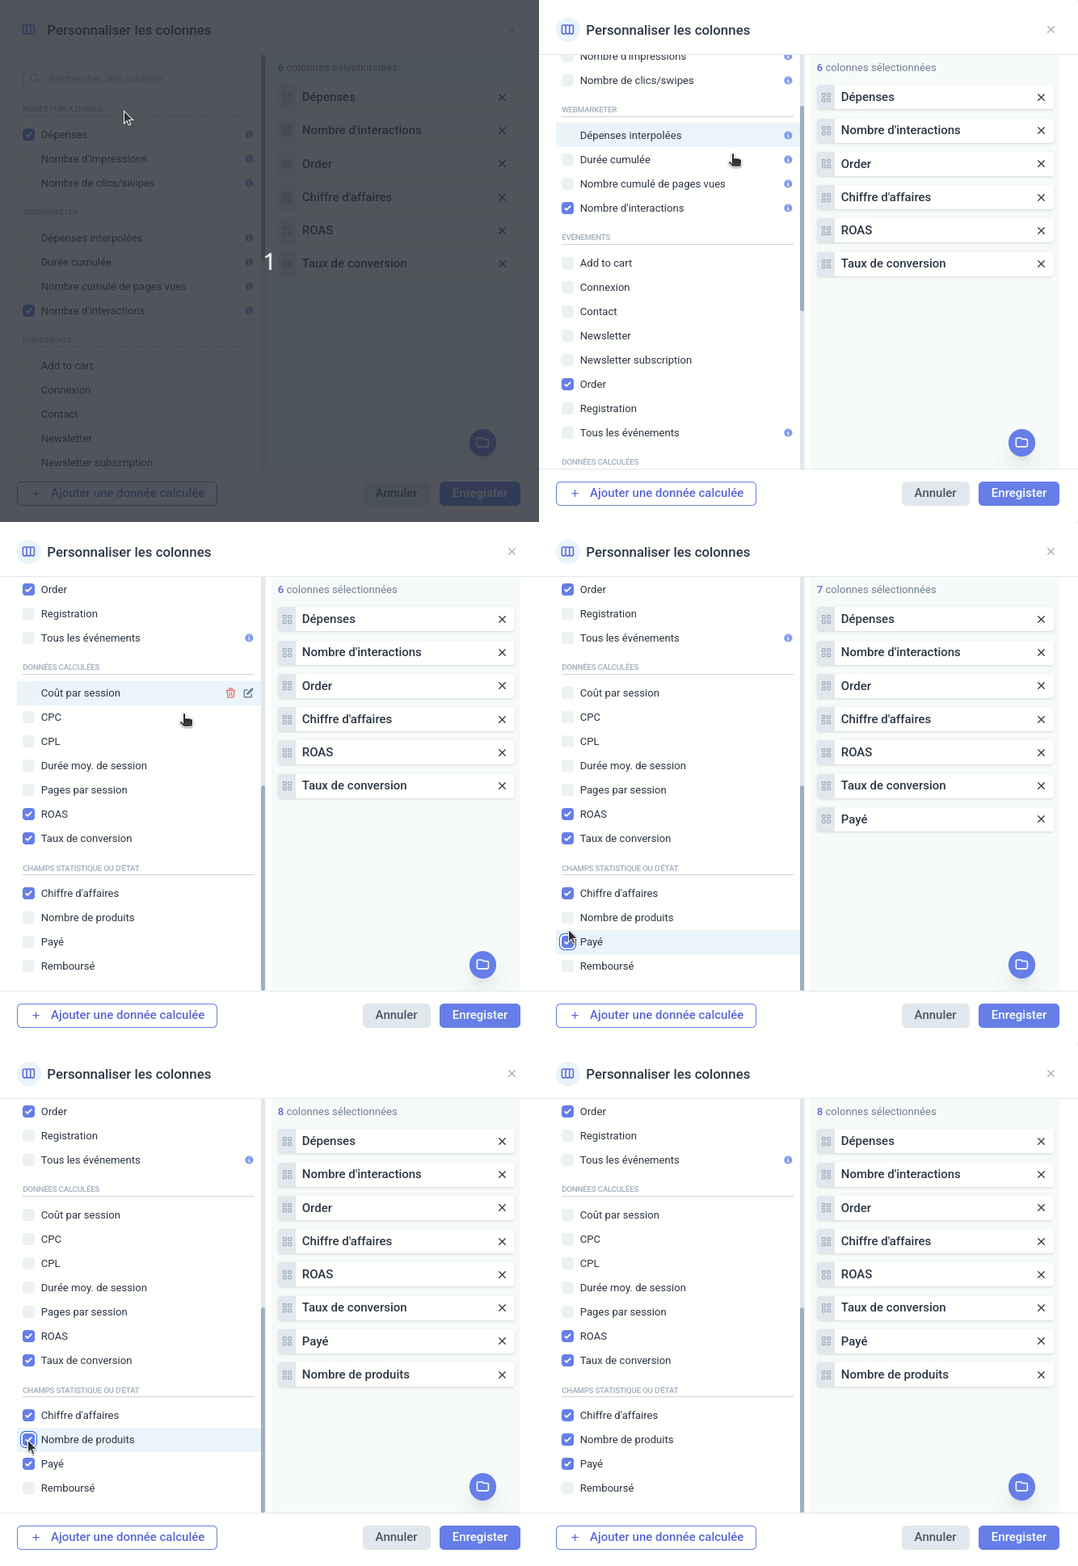
Choosing the columns
The column picker lets you choose which columns you want to display in the performance explorer.